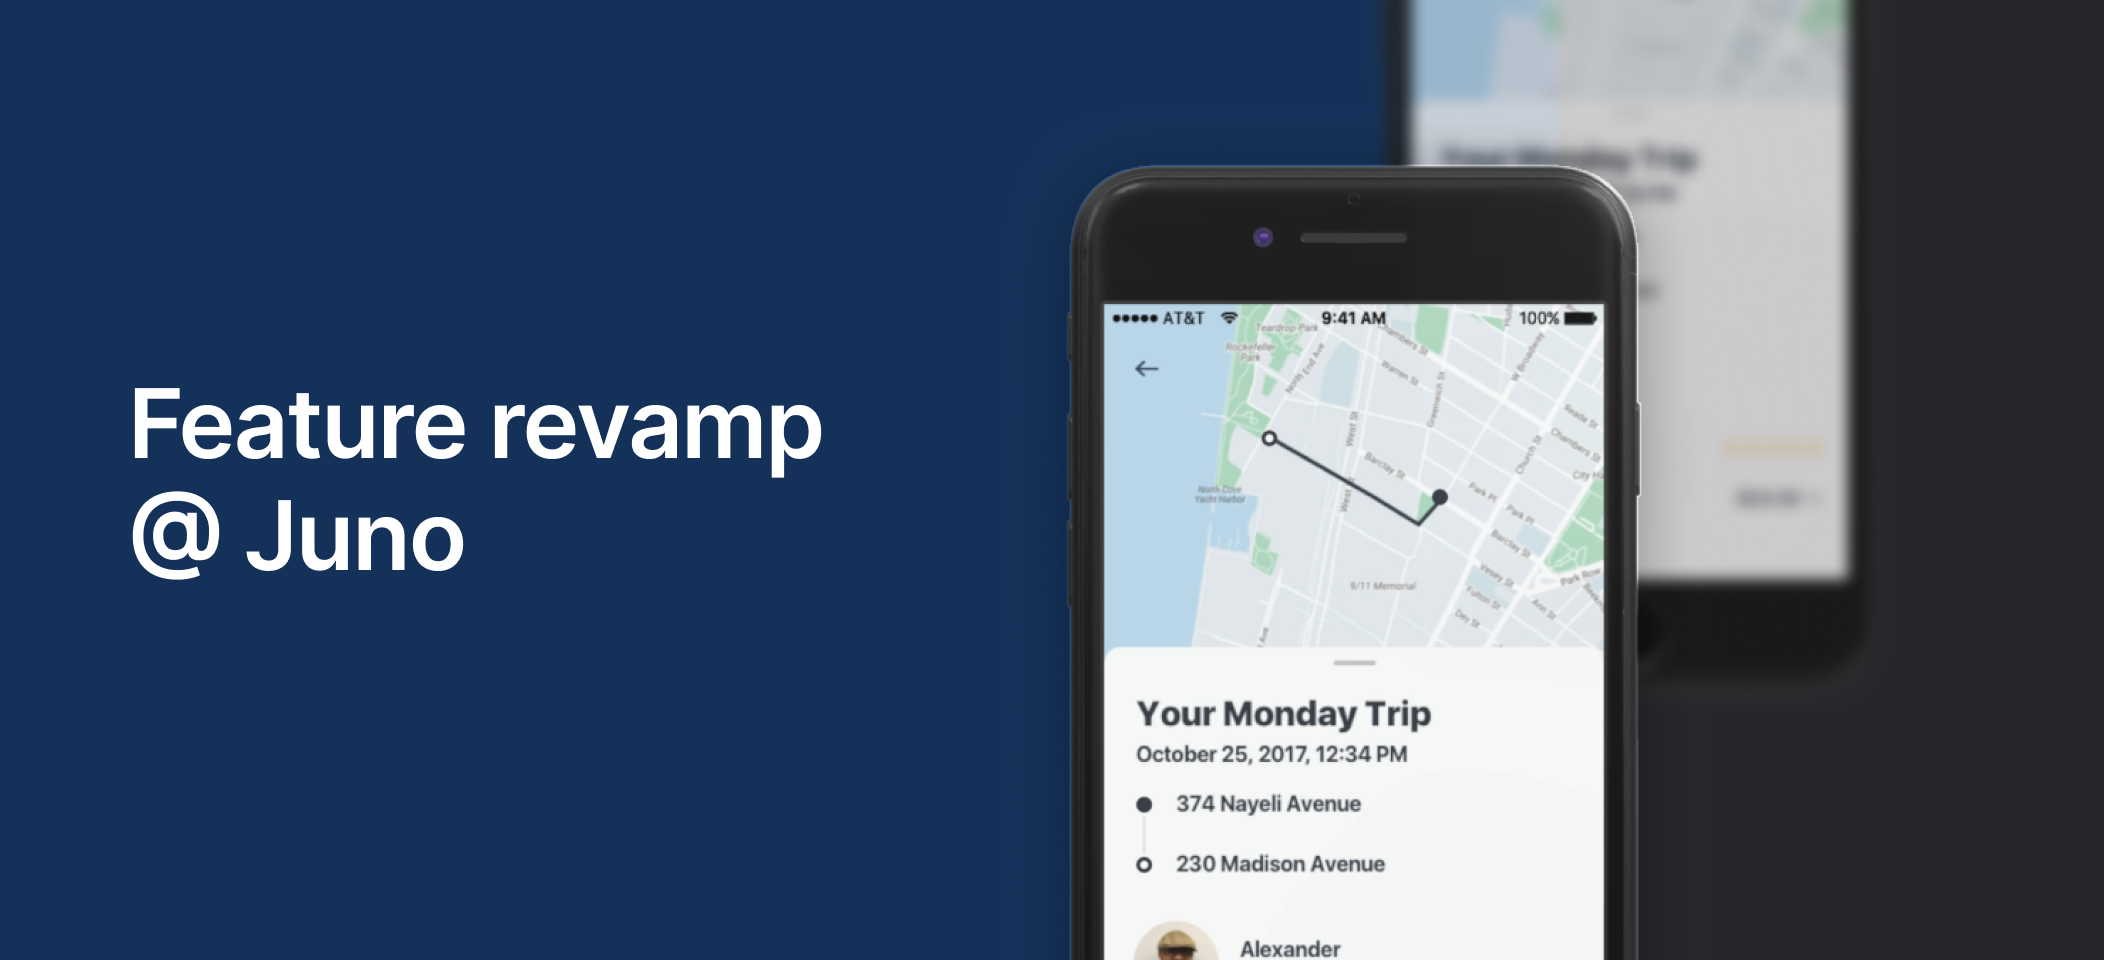
Juno was known for its 24/7 live support and detailed Help Center. Many support requests concerned previous rides, so we added trip-specific support inside Trip History. Riders could read relevant articles, open the Help Center, or call their driver about a lost item.
The feature was useful. Almost nobody found it.
The problem
The short funnel converted at just 6% of users, while support data showed that riders were still calling about fare questions and lost items - issues a short article could often resolve.
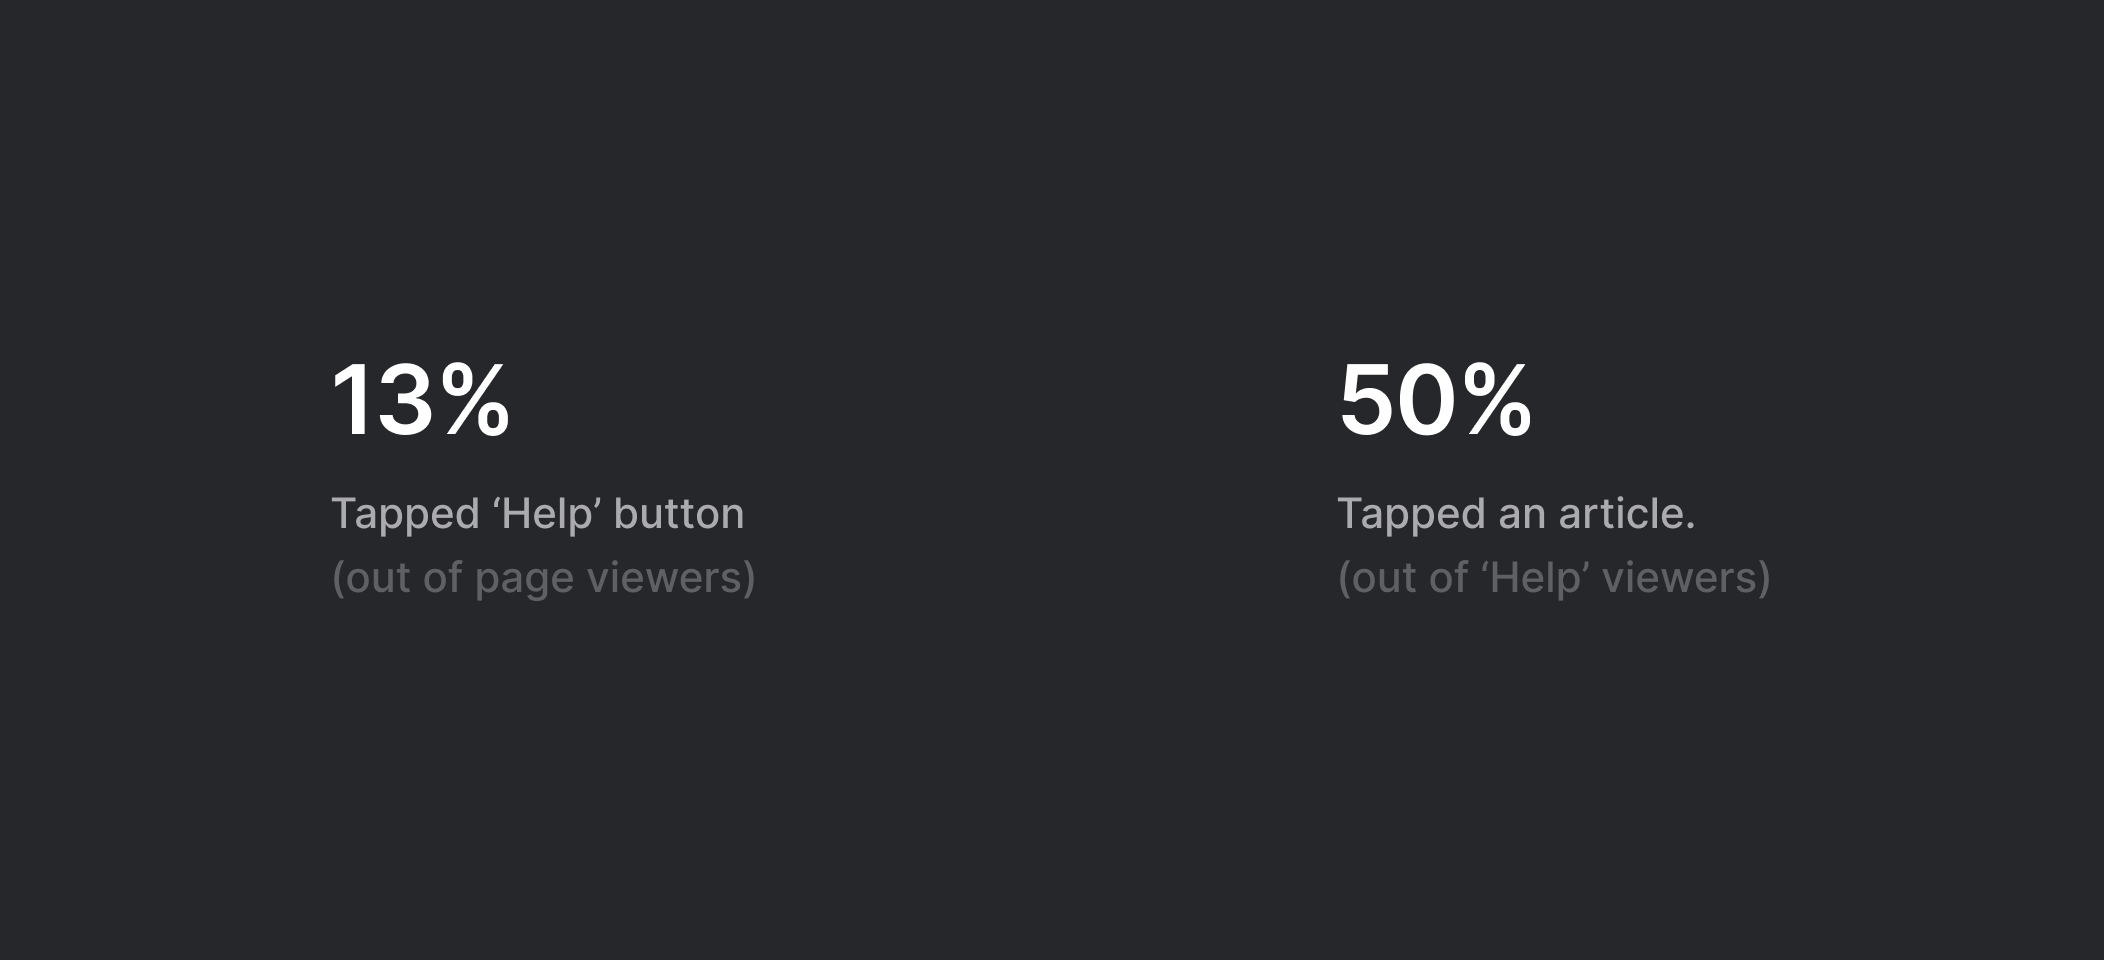
Short investigation revealed the feature itself was not the first problem; exposure was. We needed to move the 13% discovery rate, fast.
Research and constraints
Alongside benchmarking ride-hailing and adjacent products, I reviewed the current screen and identified three problems: poor accessibility, an unconventional layout that was difficult to understand, and inconsistent spacing.
My take
• Poor accessibility
• Unconventional layout
• Inconsistent spacing
Constraints
• Recent app redesign
• Small team and a lower-priority issue
We also had real constraints. The app had just gone through a major redesign, the team was small, and this was not the company’s biggest problem.
To understand why riders opened Trip History - and why they still contacted support - I surveyed our support specialists. Two needs dominated: understanding a fare and finding the driver’s details.
Iterations
I brought three options to the team, each with its pros and cons.
Shift the tabs bar
✅ Keeps the existing UI component
✅ Clarifies page categories
✅ Raises the help section in the hierarchy
❌ Separates help from the page’s main focus
❌ Compromises the map view and visual balance
Use a different pattern
✅ Uses a familiar native pattern
✅ Simplifies the layout
❌ Separates help from the page’s main focus
❌ Lowers the help button in the hierarchy
Drawer
✅ Uses an intuitive gesture
✅ Connects help to the page’s main focus
✅ Improves the hierarchy
❌ Makes help less visible
❌ Uses a pattern that was less familiar at the time
Based on the support-team findings, we chose the drawer. It felt counterintuitive: our goal was to increase exposure, yet the solution placed support behind a gesture. The contextual relationship to what riders were looking for made the option worth testing.
Outcome and reflection
The data confirmed it - In the A/B test, exposure more than doubled and settled at roughly 30%, while the exposure-to-use ratio remained stable at about 50%.
I did not get to validate the concepts through usability testing, and I reached the support-specialist survey later than I should have. Still, the project taught me how to use behavioral data as a design input - and how to test a counterintuitive decision instead of defending it through opinion.